All over the world, the birth of a child has a much higher impact on the careers of women than men. This effect is called the “child penalty”. But how can we measure it?
This page is a step-by-step guide to help you understand how we calculate the child penalty in employment – that is, how we measure the effect of becoming a parent on women’s probability of being in paid work, when compared to men.
What the measure means
The child penalty is always expressed as a percentage, ranging from 0 to 100. A child penalty of 20% in employment means that women’s employment fell 20% behind men’s employment after having children. A child penalty of 0%, by contrast, would imply that there is perfect equality in how men’s and women’s employment are affected by the arrival of a child.
Employment of women and men are different before having children
The first step in calculating the child penalty is to follow mothers and father’s employment before and after having a child for the first time. Figure 1 shows the proportion of men and women employed around the time they have their first baby, using data from Chile as an example. The red line shows the moment in which the child is born.
Figure 1
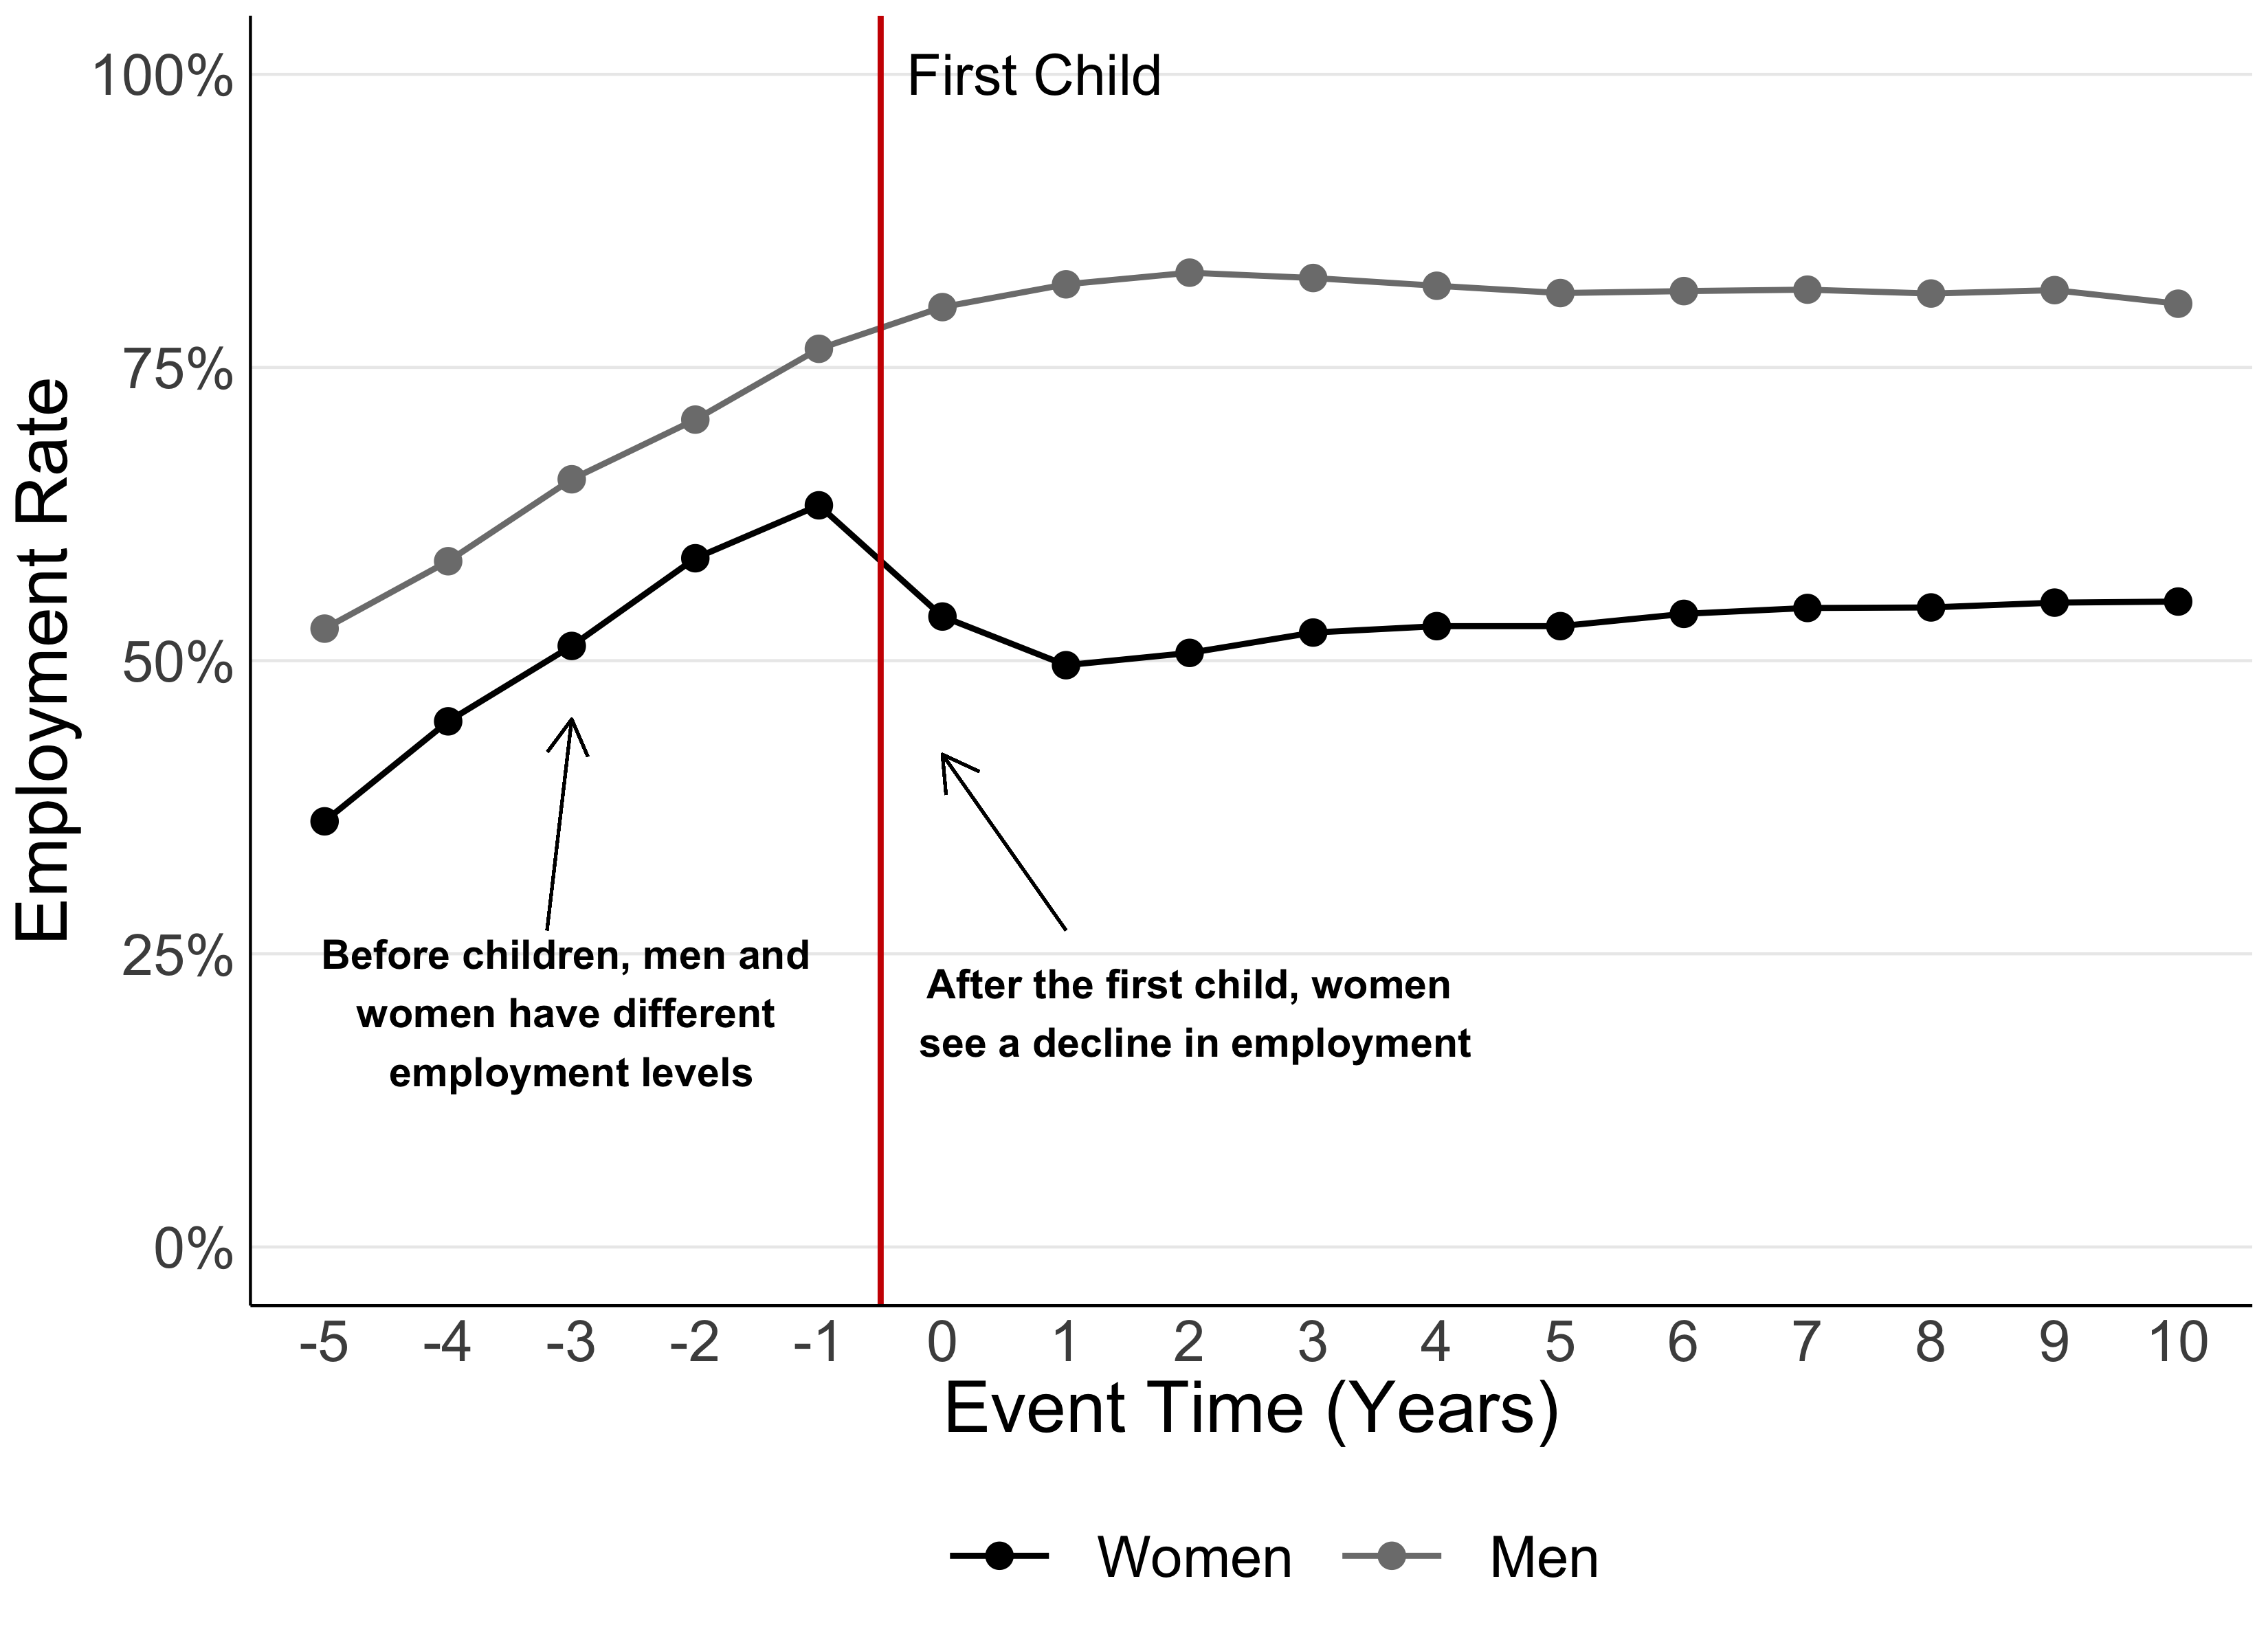
We can see that, before childbirth, both women and men’s employment are increasing, and women have a lower employment rate than men. Shortly after the baby’s arrival, women’s employment plummets sharply, while men’s continues on a relatively smooth upwards trajectory. After a few years, both men and women stabilise – but women’s employment never returns to pre-child levels.
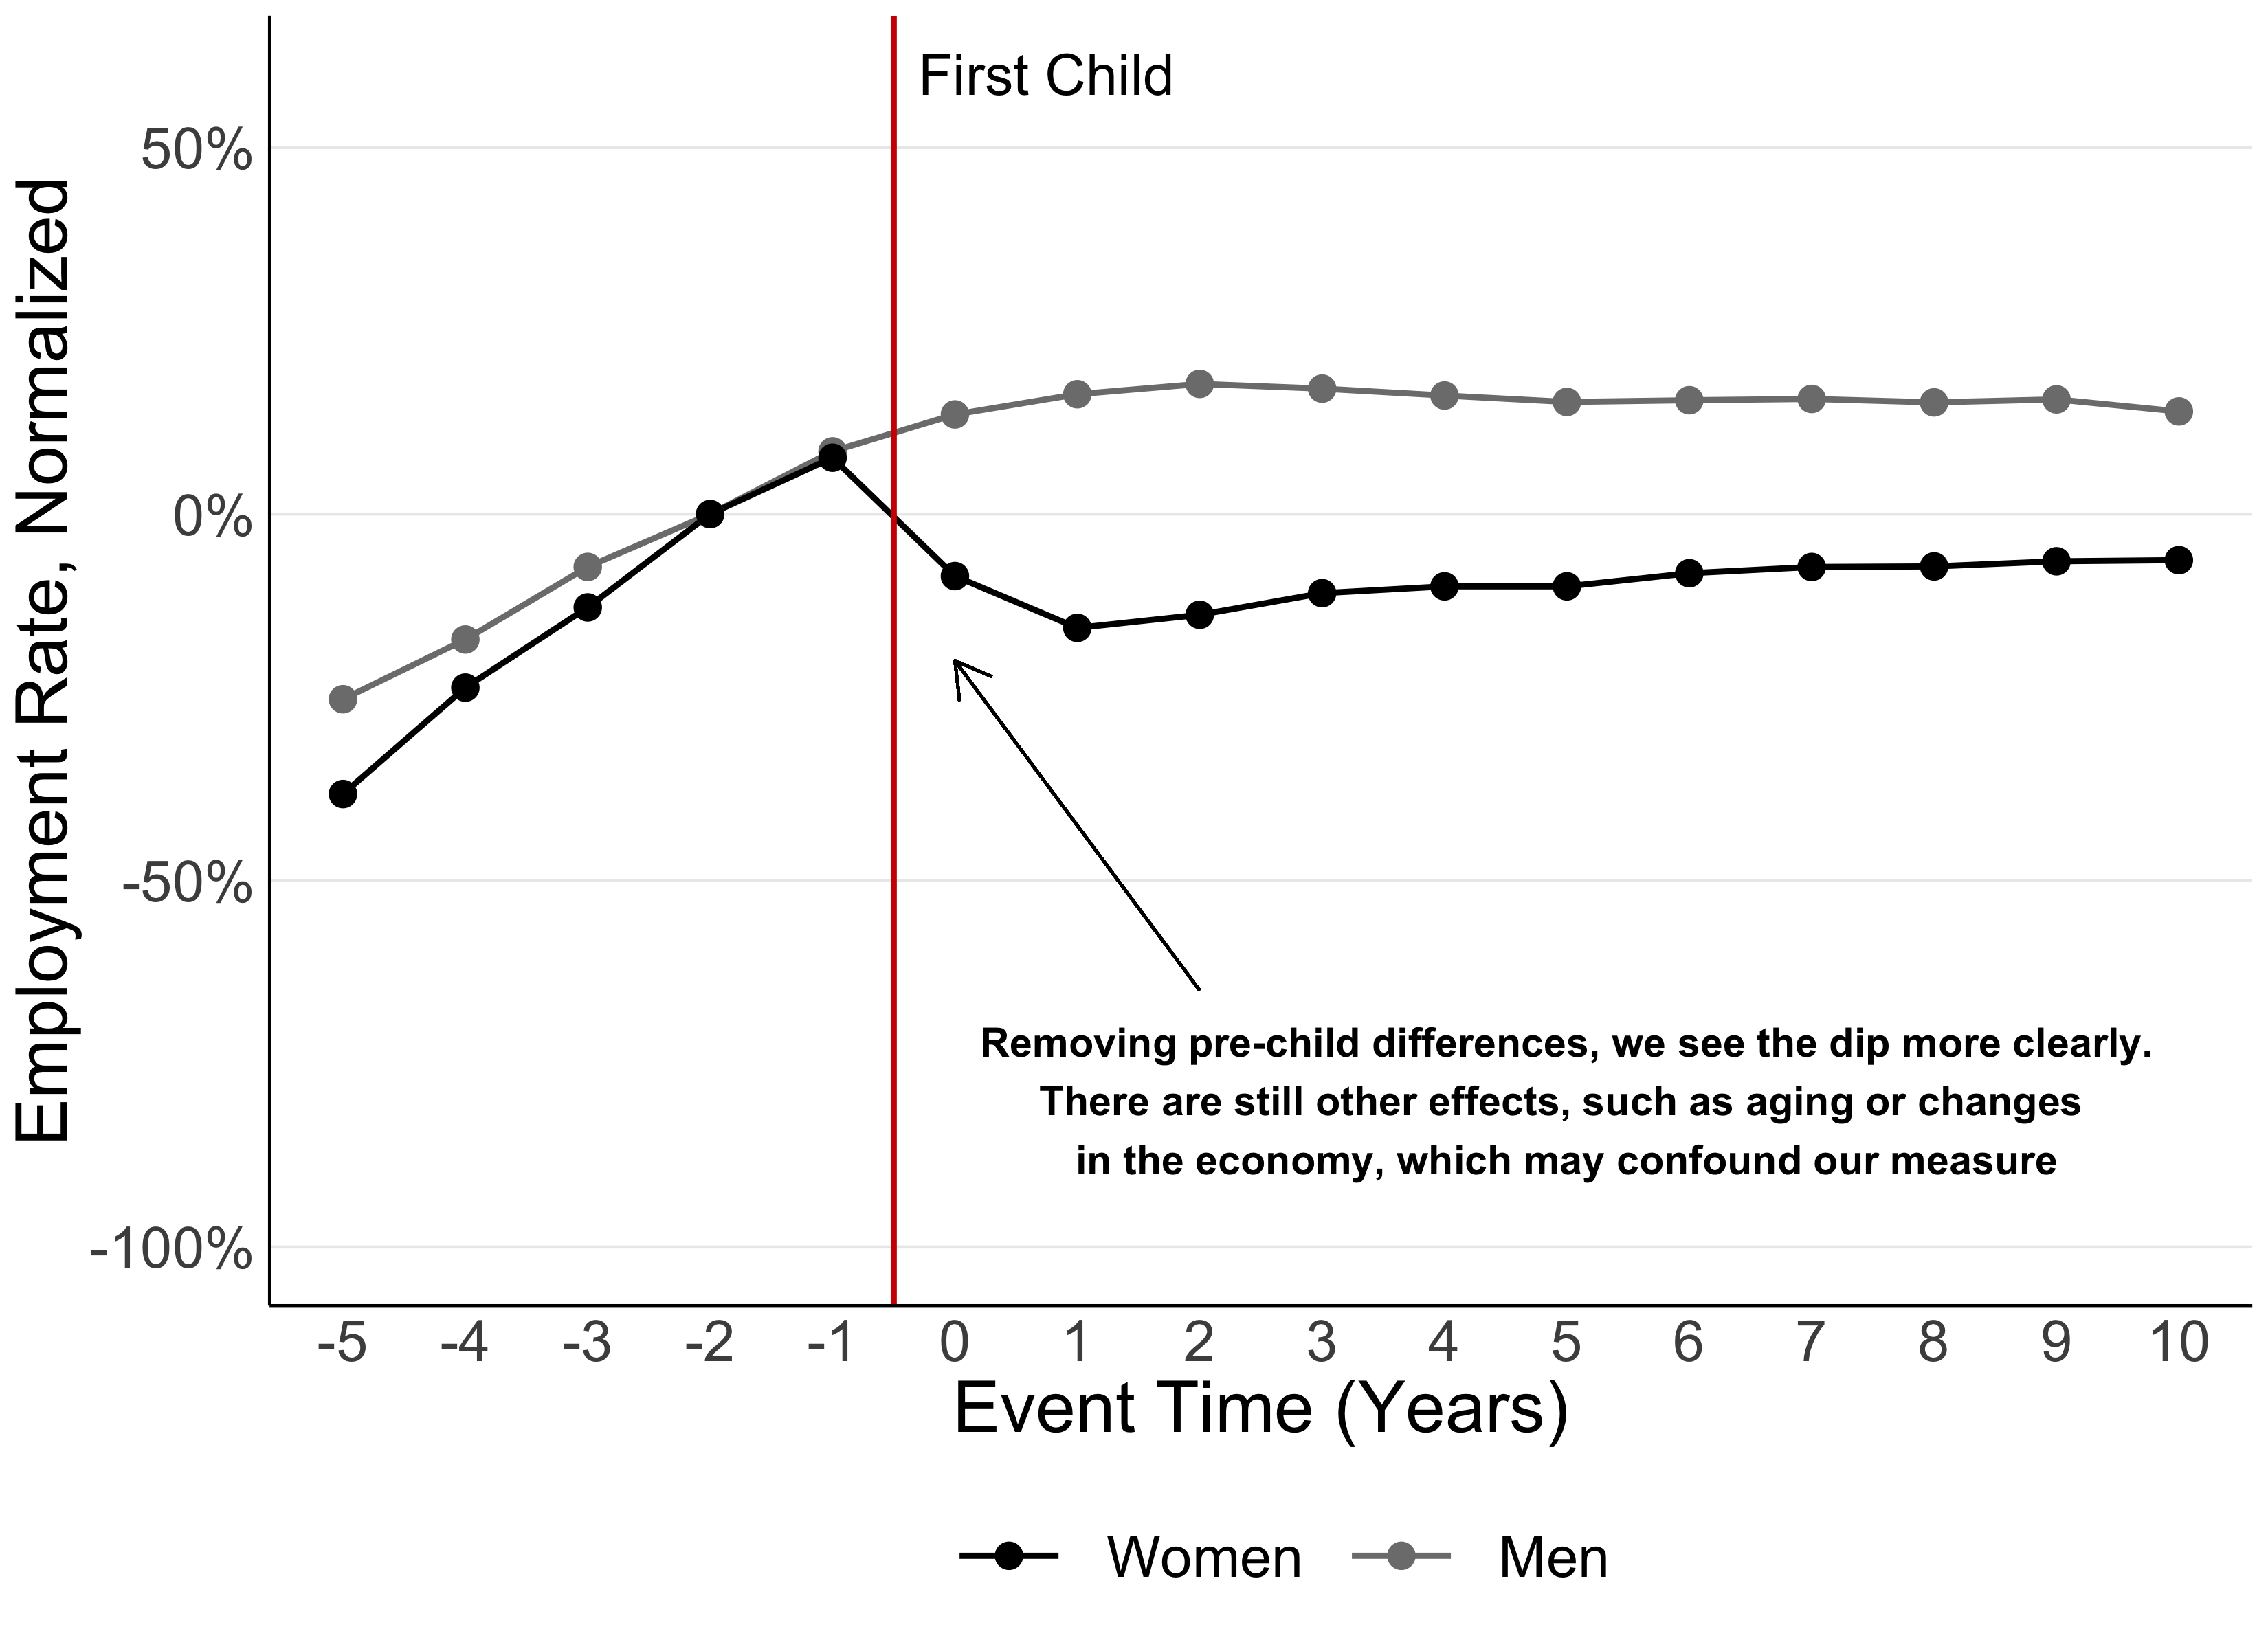
If we want to isolate the effect of the child’s arrival, we must eliminate the difference in employment between men and women before the birth of the first child. To do that, Figure 2 shows men and women’s employment relative to what it was two years before childbirth (notice that the value for both men and women is zero at -2). This enables us to focus on the effects of children.
Figure 2
Is it your child, or are you just getting older?
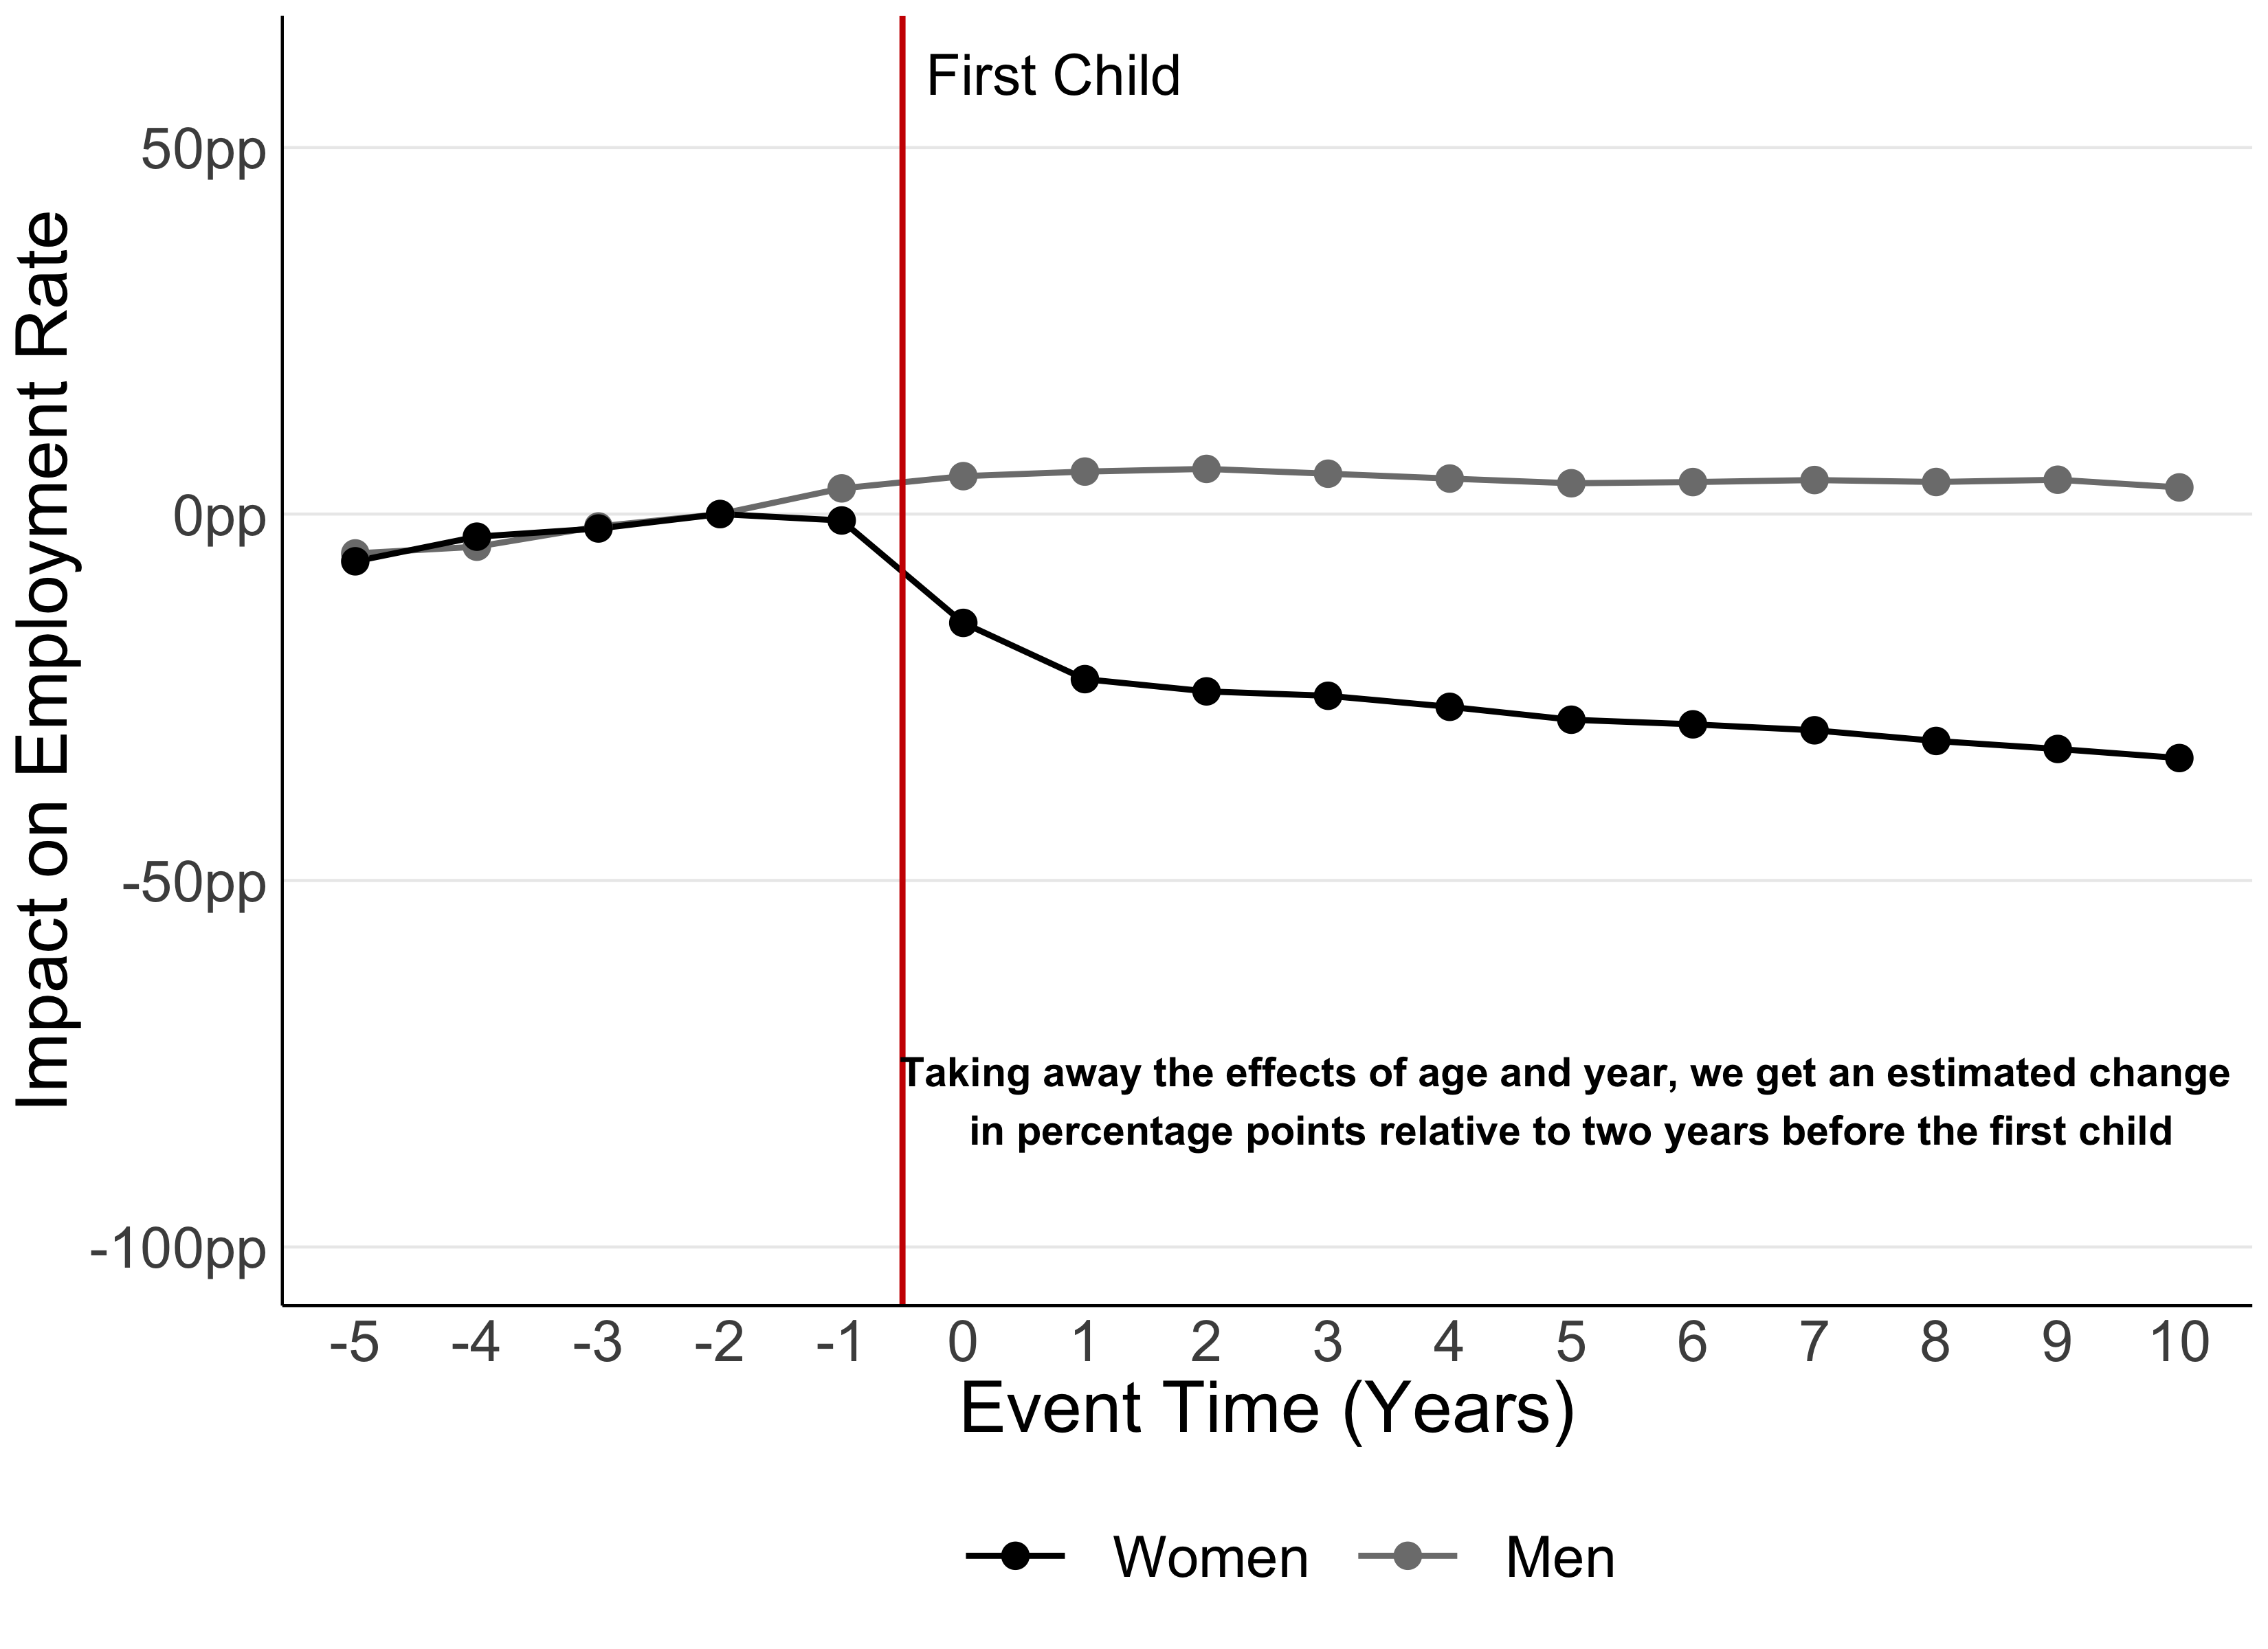
There are, however, other things that may be interfering with what we see in Figure 2 which are unrelated to the arrival of a child. As the child gets older, so does the parent – and we know that older people are more likely to be employed. There might also be changes in the economic situation that affect both men and women’s employment over time, and that are unrelated to childbirth.
All of these contribute to employment trends that could be “confounded” with the effect of children. Our next step is, therefore, to control for these effects of age and year, to remove potential confounding factors. Figure 3 shows what happens: some of the overall trends we saw in Figure 2 are now gone.
Figure 3
To scale or not to scale?
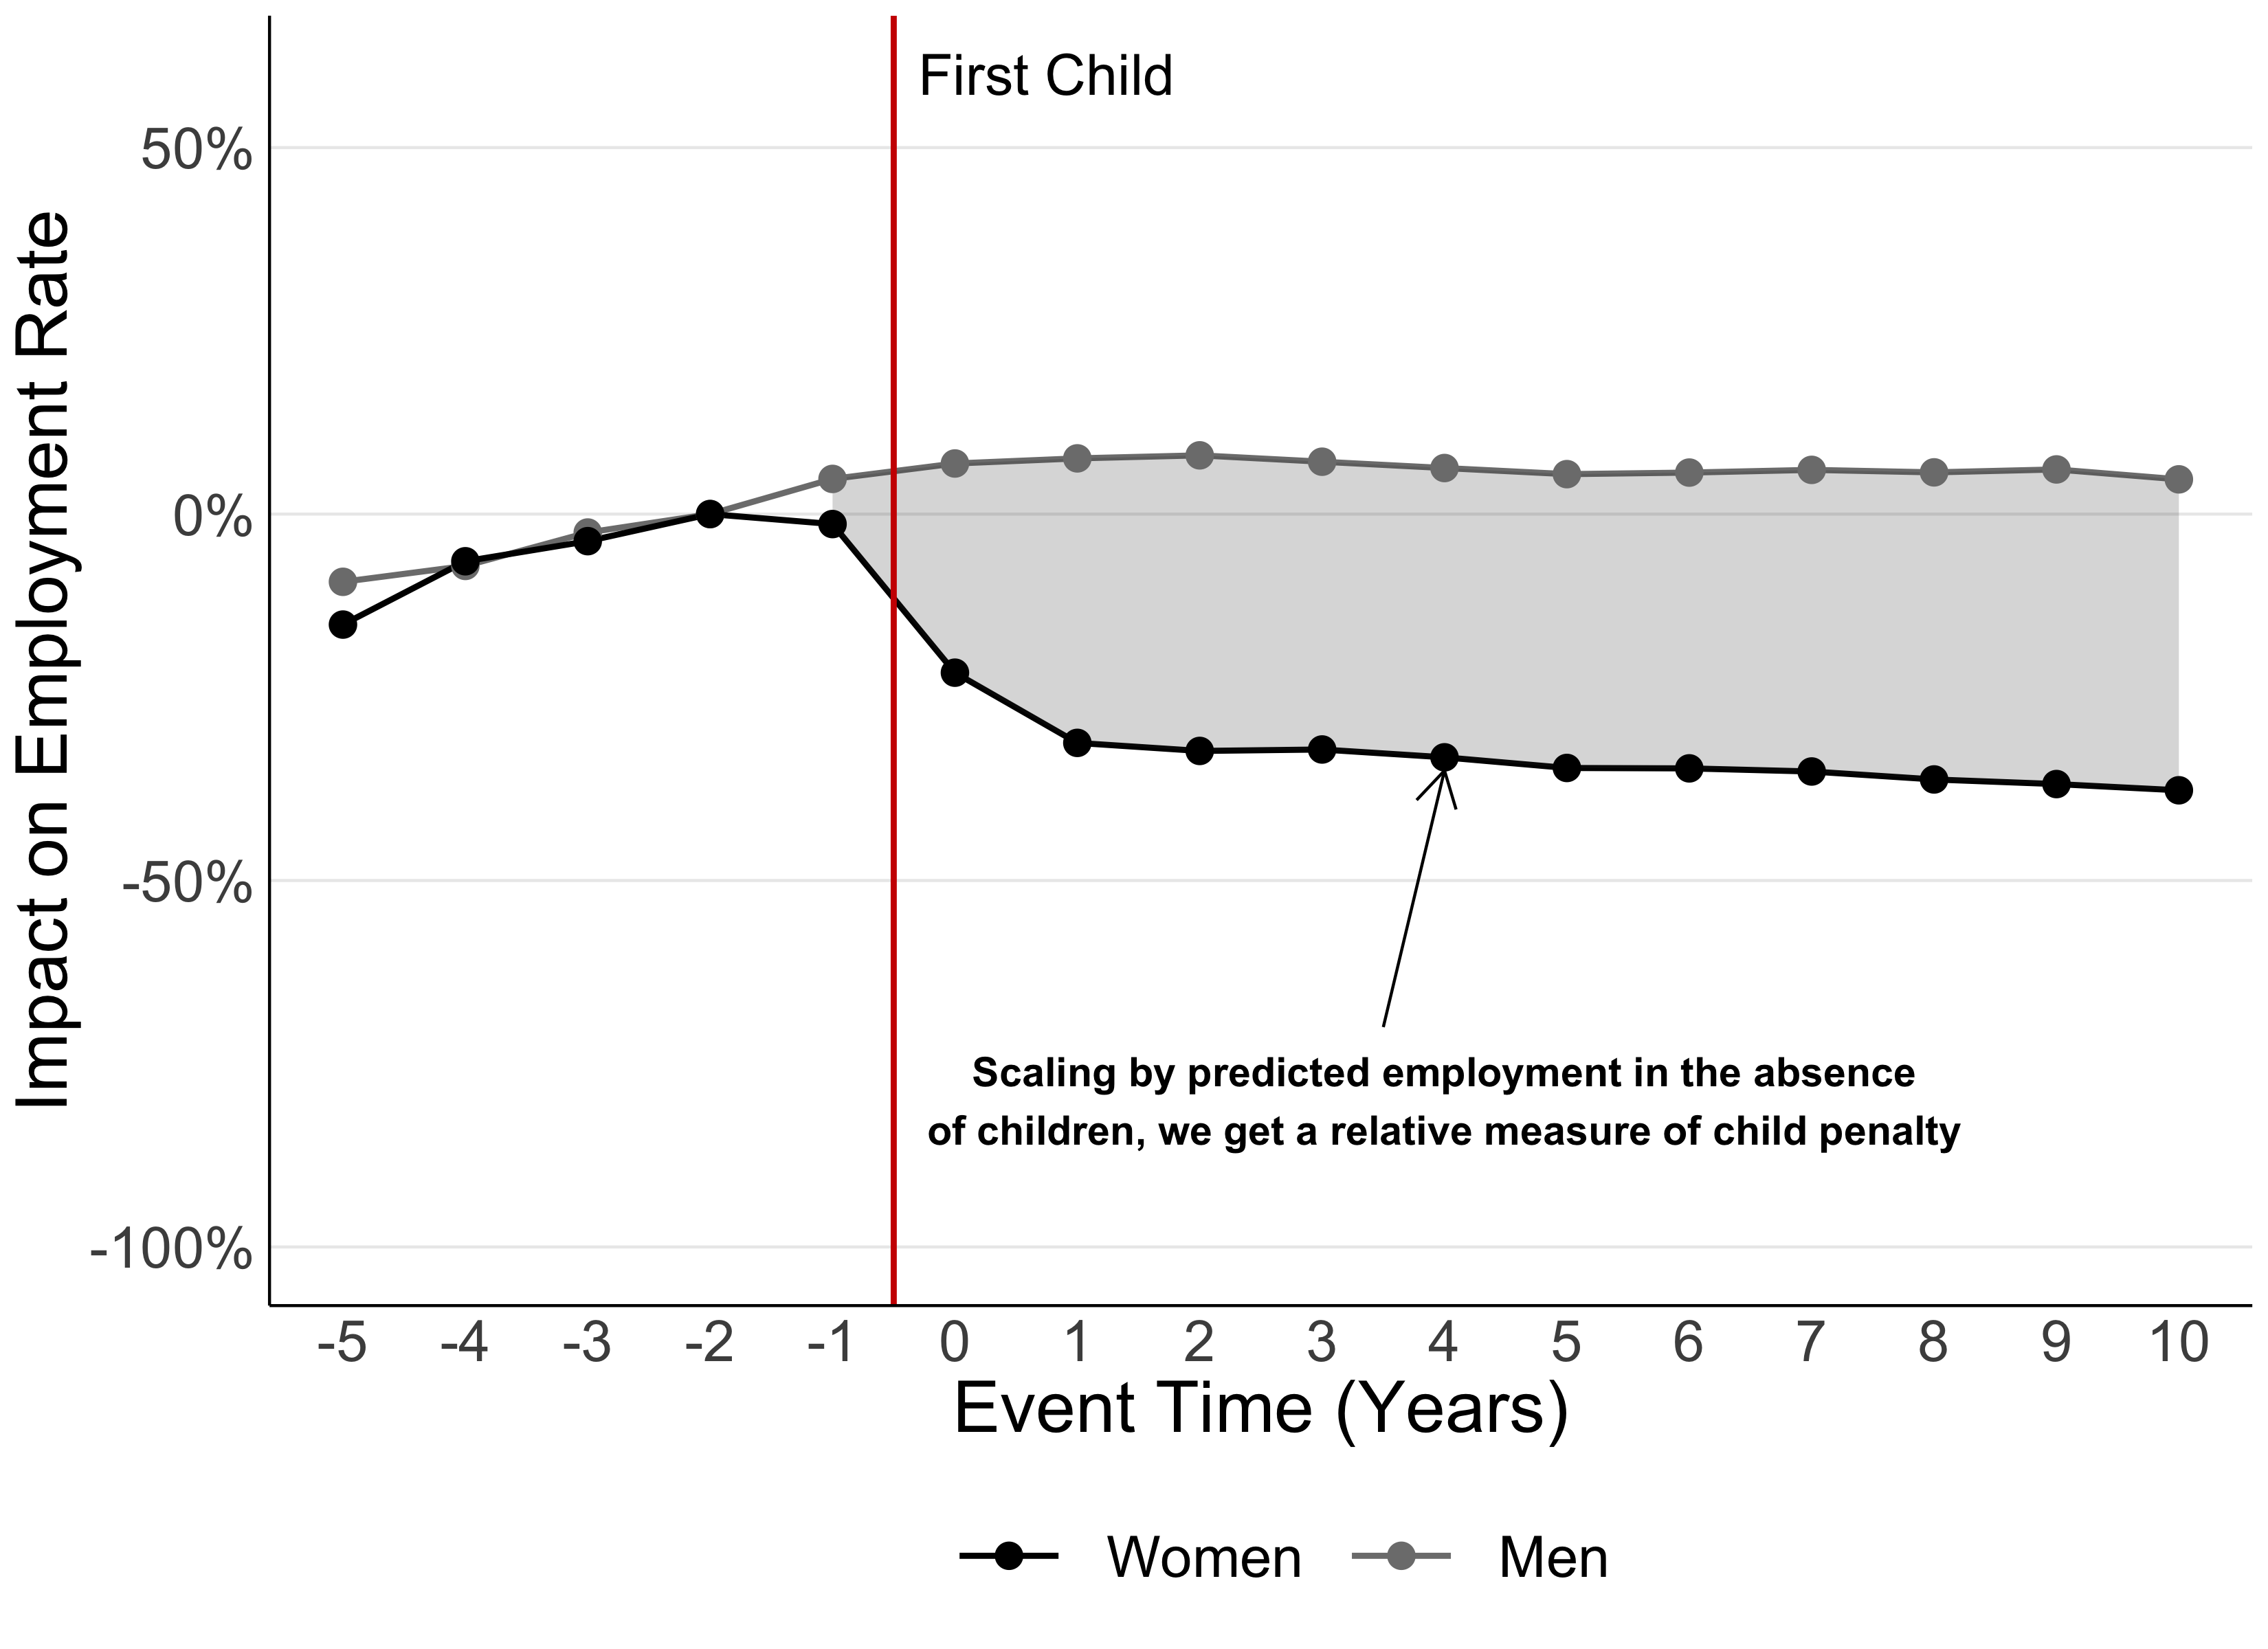
We now have causal estimates of the effect of parenthood on women relative to men. These estimates are ‘unscaled’ because they are expressed simply in terms of percentage point change relative to employment two years before the child is born. This can be a misleading indicator of how parenthood affects men and women in the different countries.
To understand this, let’s compare two countries: Pakistan, where overall female employment is 17% , and the Netherlands, where 85% of women are employed. The ‘unscaled’ child penalty in Pakistan is 5 percentage points. This seems much smaller than the Netherlands’ unscaled child penalty of 20 percentage points. However, this can be misleading because of Pakistan’s low rates of female employment overall: a 5 percentage points decline due to children is, in fact, a very large effect!
To make our measure more meaningful, we express the child penalty as a proportion of the employment level that we would expect to see for women and men if they did not have children. This ‘scaled’ estimate enables us to reflect more adequately the differences in female labour force participation across countries. When we do this, Pakistan and the Netherlands actually have the same child penalty of 20%.
Figure 4
What if I can’t follow people over time?
Current methods used to study the child penalty require access to extensive data in which a large number share of the population can be followed over a long period of time, so we can see people before and after they have children. This is difficult, as such data is typically only available for a small number of highly developed countries – with some notable exceptions, like Chile from the example above – limits how much we can study global differences in the child penalty.
To overcome this limitation, we make a major methodological innovation which enables us to calculate child penalties using much simpler data that doesn’t necessarily follow the same people over time, such as household surveys or a sample from the national census.
In those cases, we know the age of people’s oldest child, so we know what happens to women and men’s employment after having children. But because we do not observe the same people over time, we do not know what their outcomes were before they had children. How do we address this? In a nutshell, we ‘match’ each observed individual who has just had a first child (i.e., they are at t=0) to a childless person with similar characteristics who is n (n varying from 1 to 5) years younger. We then assume that this childless person will have a child in n years from now. Effectively, we create a population of “future parents” from the population of people who don’t have children and who are very similar to the actual parents we observe. A more detailed explanation of our methodology can be found here.
But does it work?
Figure 5
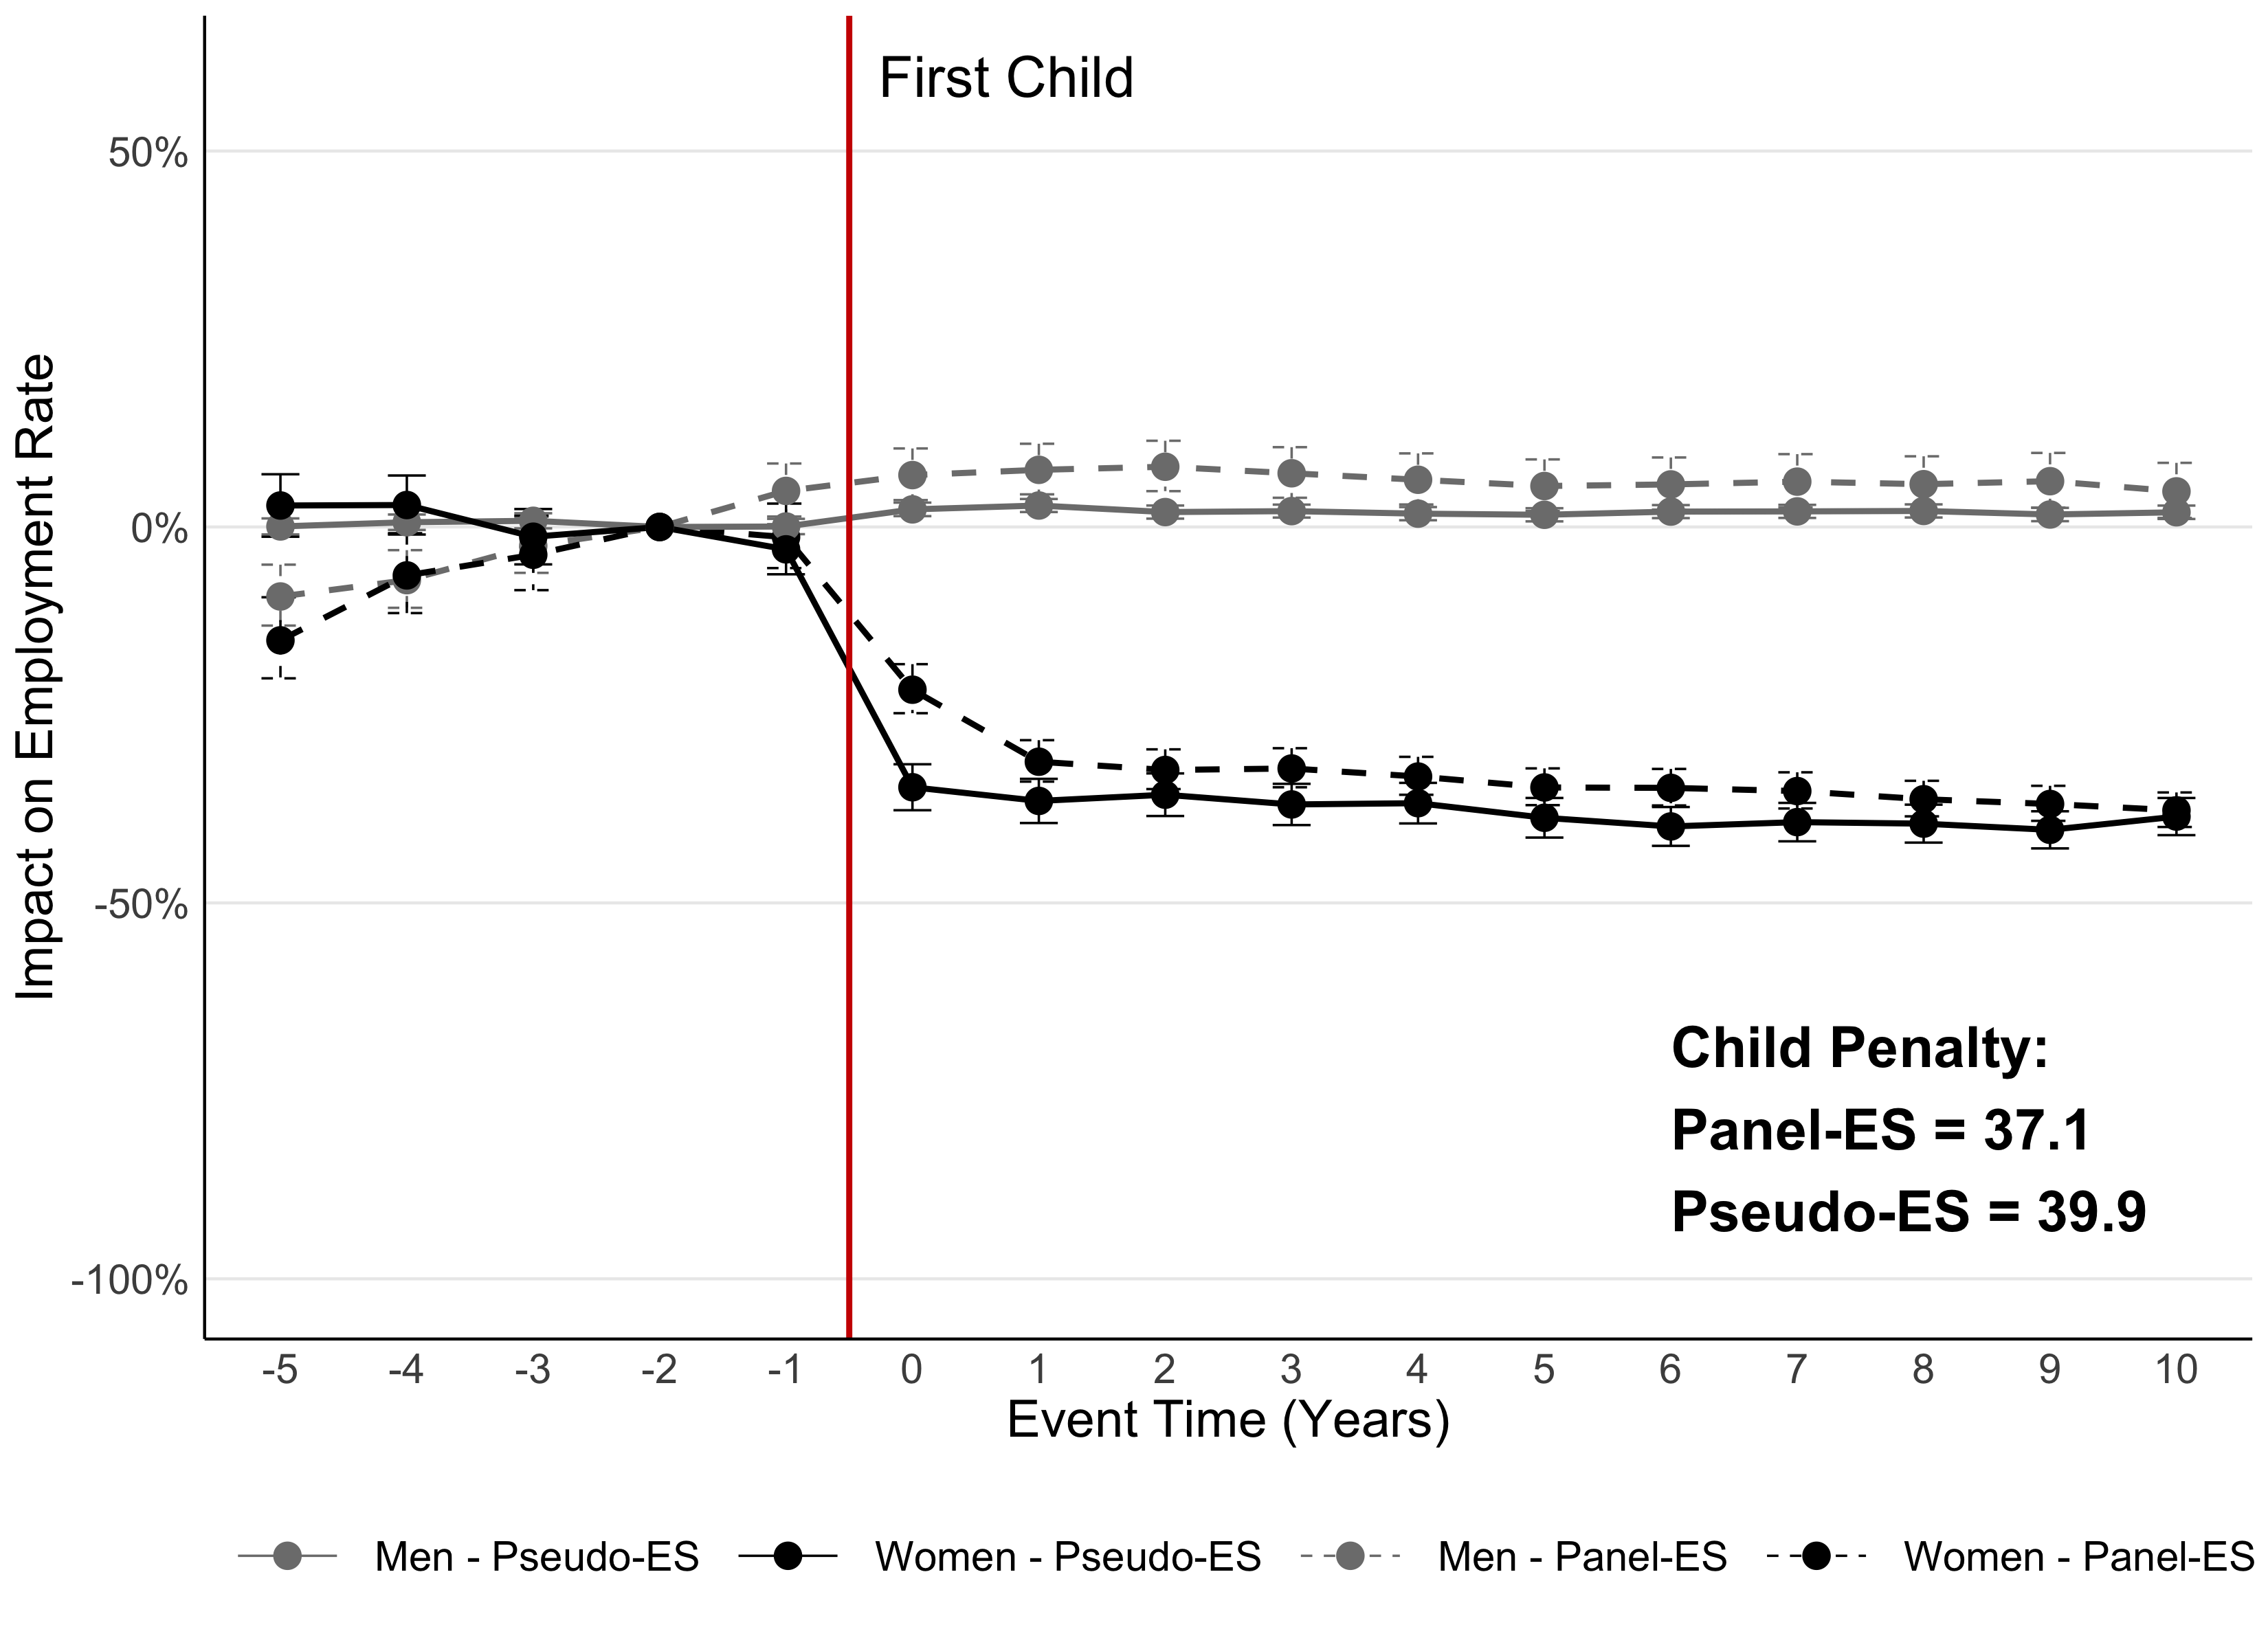
It does! To verify that our method works, we can use countries for which we do have a good dataset where we can follow people over time. We compare our “matched” approach, where we can’t follow people, to the usual approach. Figure 5 shows this validation for Chile: both methods give very similar results.
Figure 6
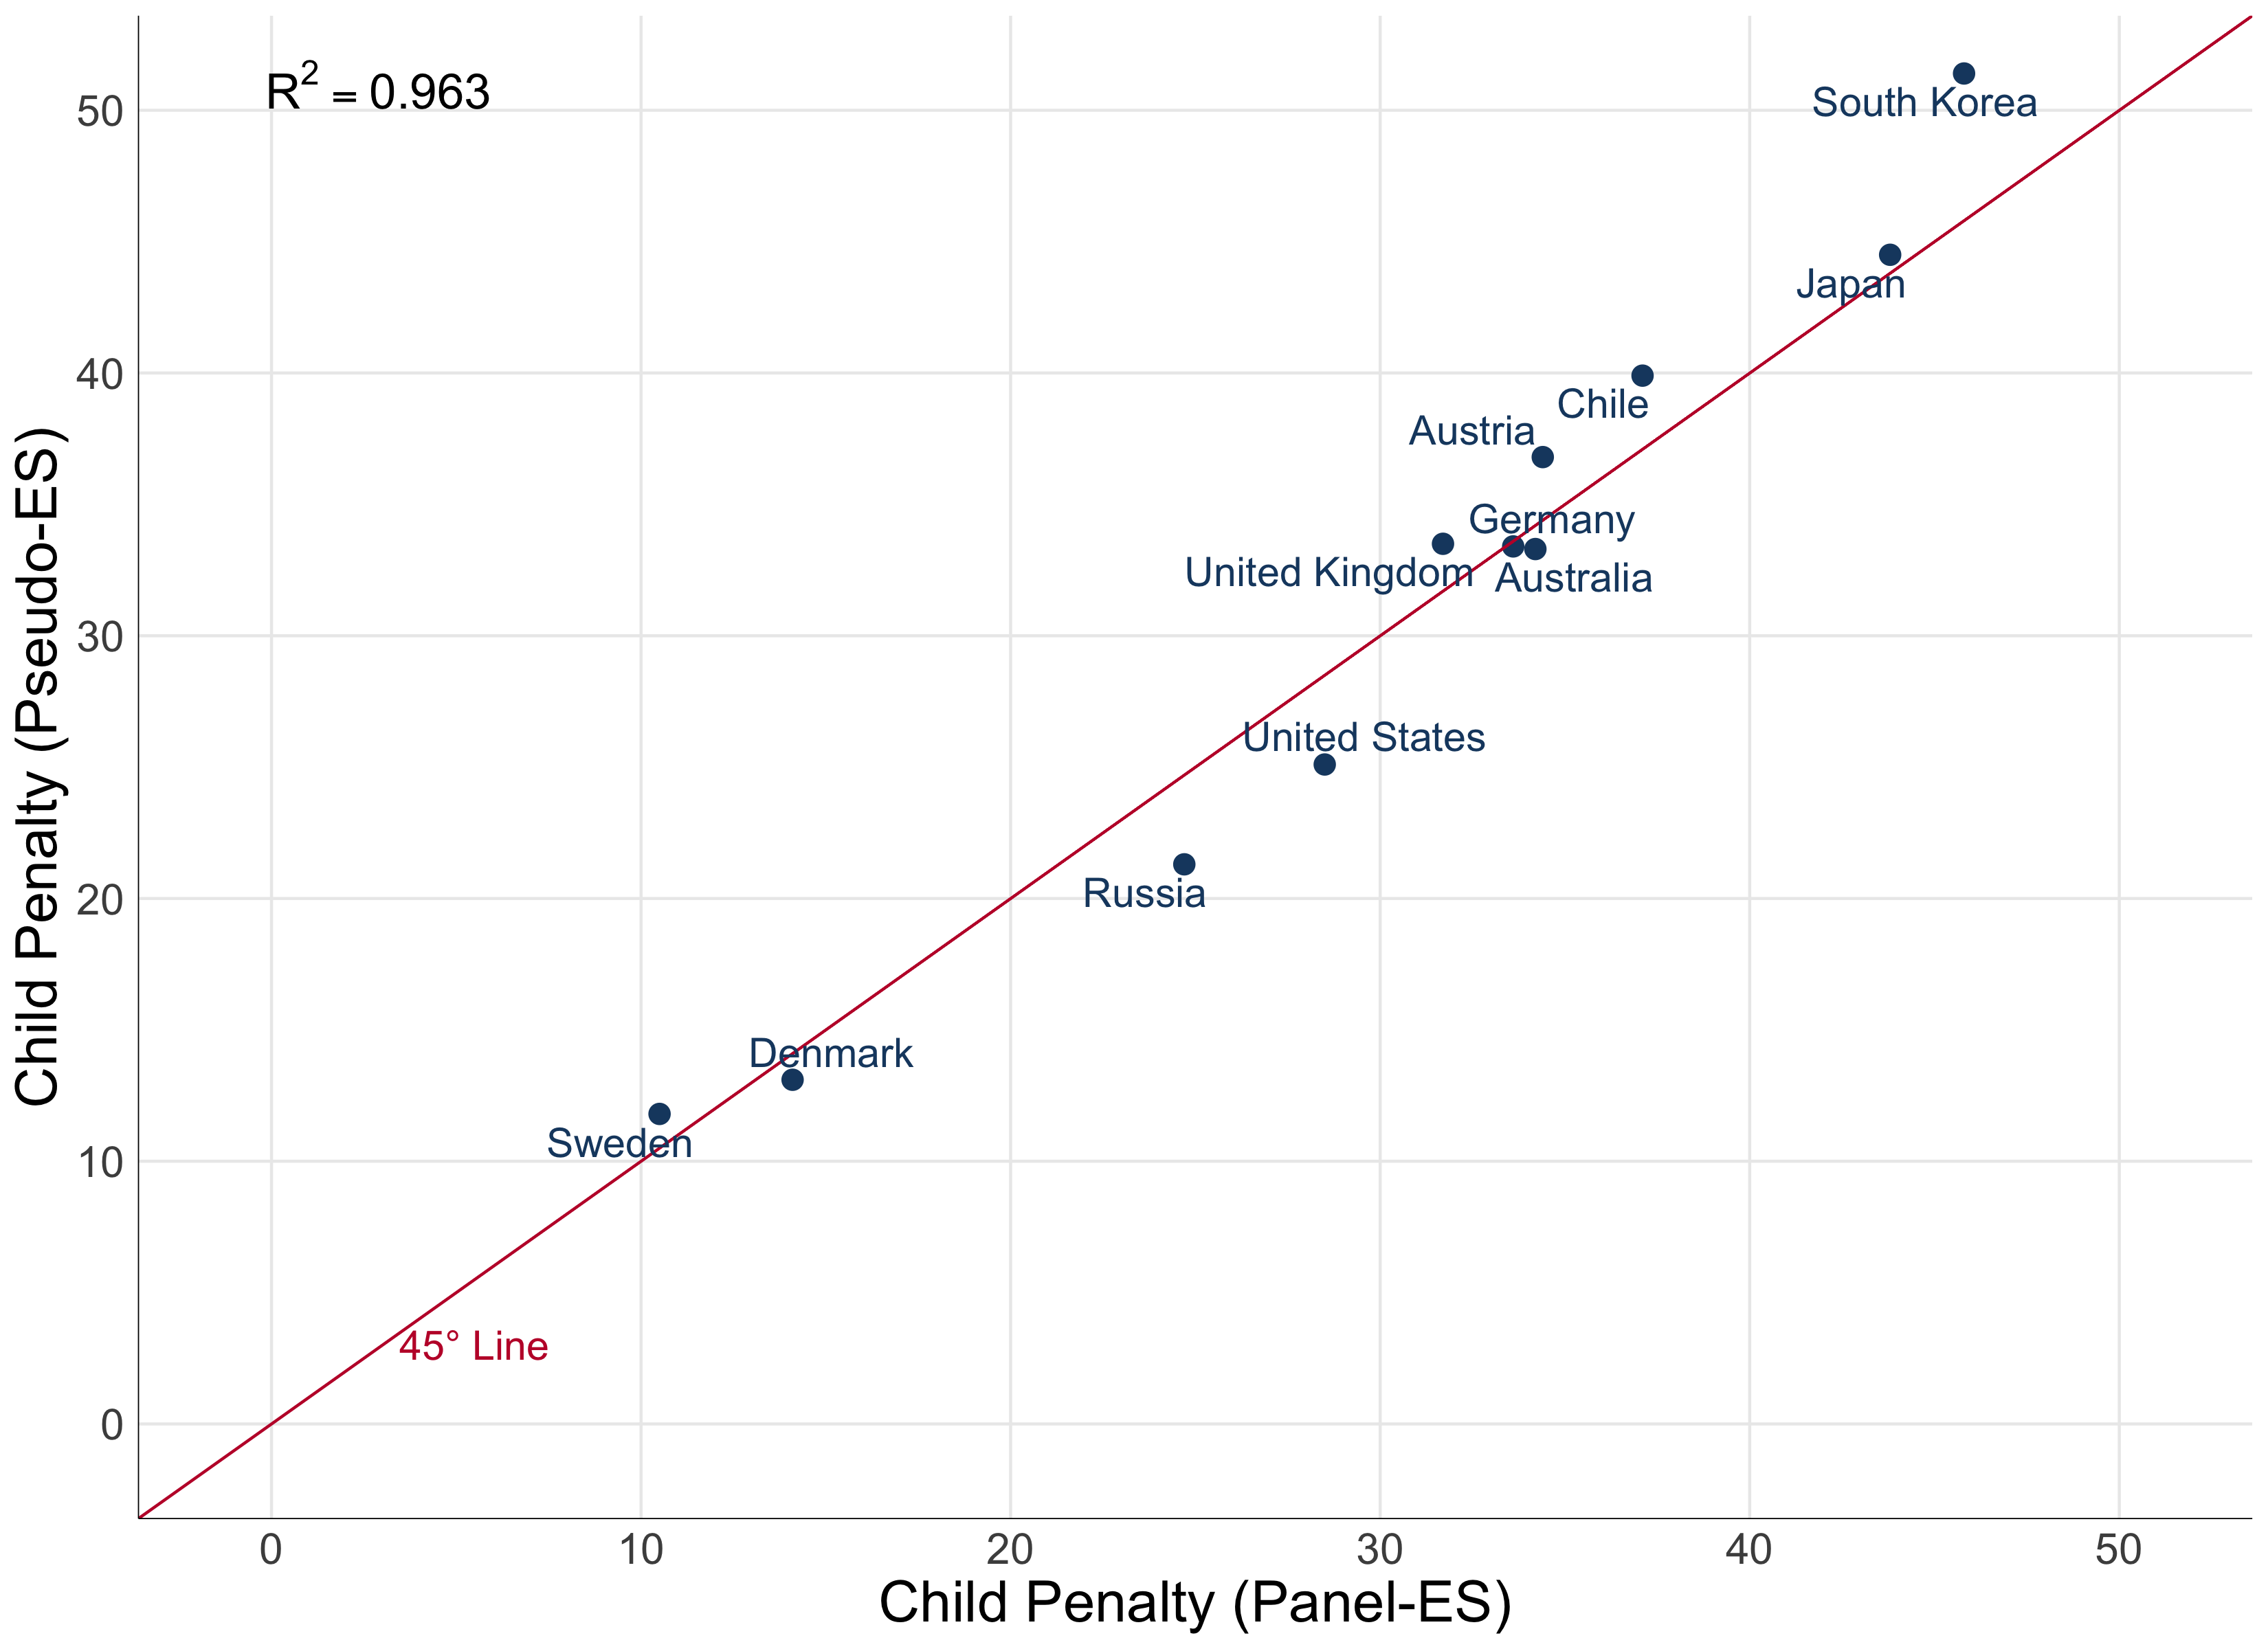
Figure 6 shows a comparison of the child penalty obtained using both approaches for all countries for which we have data that allows us to conduct this test. The child penalty estimated using both methods are very similar in all of them. That means we can confidently expand our “matching” strategy to countries where we do not have a panel, and construct the Child Penalty Atlas using simpler types of data.
Statistical uncertainty
Finally, it’s worth noting that all our estimated child penalties come with some degree of statistical uncertainty. This is because of two main reasons: first, for almost all countries, we only observe a sample of the population rather than the entire universe of people; second, there is measurement error in our data, which brings some imprecision to our estimation. Throughout our analysis, we show our estimates together with a 95% confidence interval. This means that there is a 5% probability that the true value of the child penalty lies outside of the limits we present.